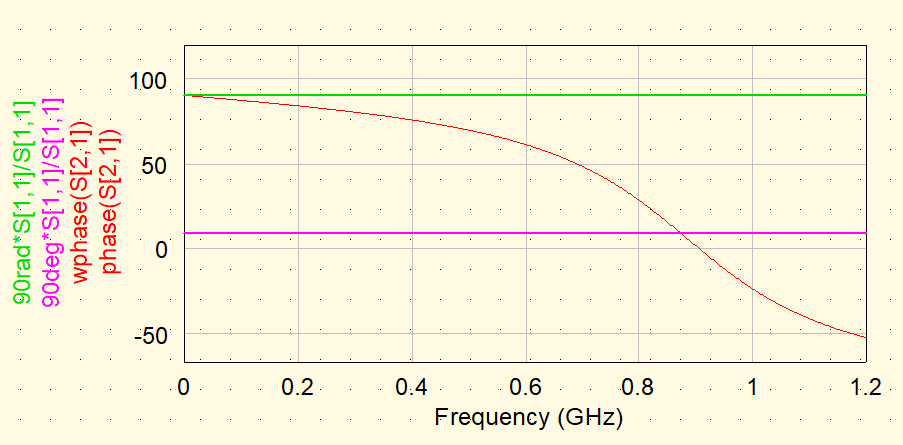
Please look at the plot, you should understand everything.
To those who are familiar with HFSS these results may look insane.
The phase/wphase function should and returns degrees.
In this plot any other function by default returns radians.
When drawing a constant level in degrees it is scaled down.
And when drawing a constant level in radians it is rendered in the same scale as degrees.
What should be? The same scale of the plot. Presumably radians by default as a base “unitless” scientific/engineering scale.
For implementing degrees, a scale setup should be implemented.
And two functions for convertig the scale should allow scaling up or down the data to the scale of the plot.
.