Hello Mario,
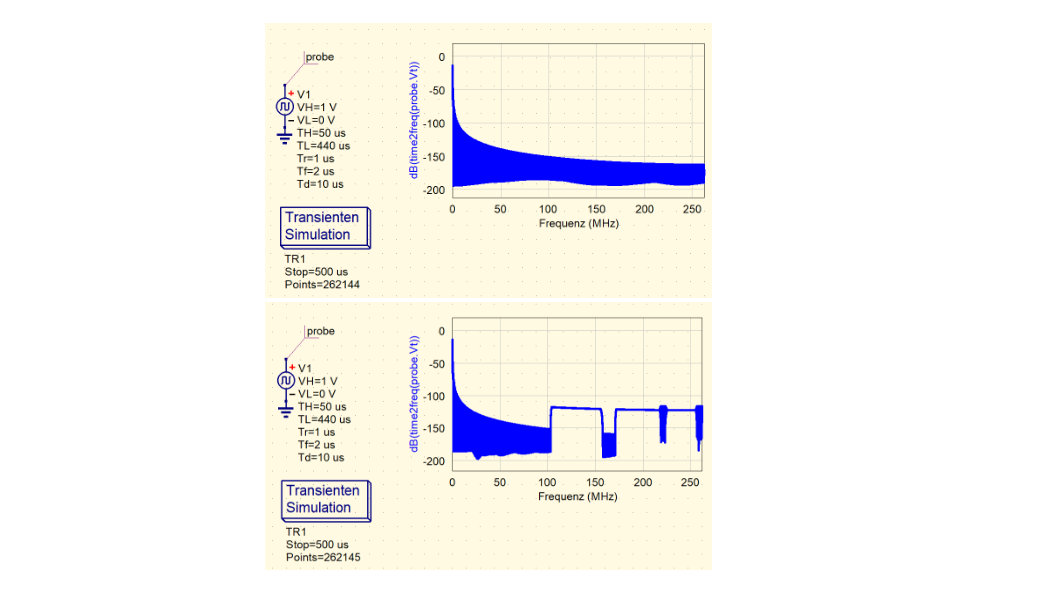
I assume you do not like the edged shape of the graph in the lower diagram. Obviously, uSimmics choses sampling frequency for the time2freq-function only depending on simulation stepwidth, as the automatically created maximum frequency value of the diagram is 1/2*stepwidth but rise and fall time of the source signal have no influence. Hence, the user has to chose the stepwidth small enough so that Nyquist’s theorem is not violated.
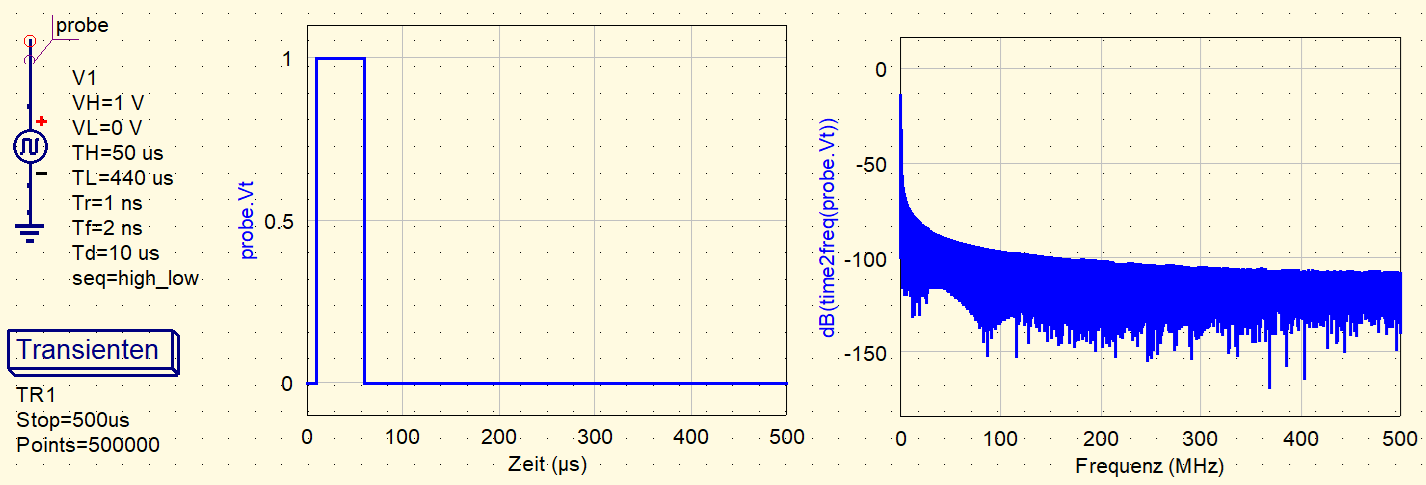
In your second example the stepwidth of the simulation is 2.5ns but rise and fall time of the pulse are smaller (1ns and 2ns). If you decrease the stepwidth to 1ns (=500000 points) then you get the expected result. The rough upper side and lower side of the graph are purely graphical artefacts due to the high density of points.
The fact that the value of 262144 yields a smooth graph in your first example is only an unfortunate coincidence.
.

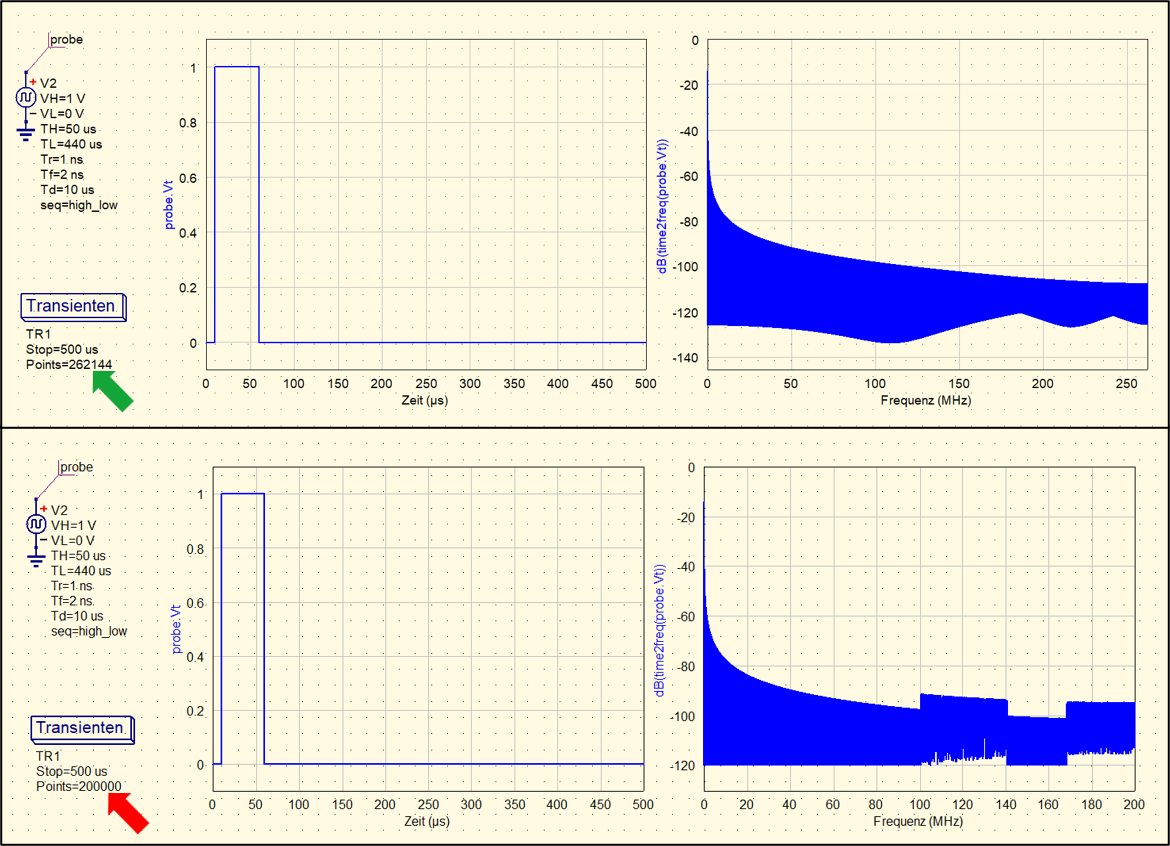 There seems to be an issue regarding the DFT.